

One person messages you. They tried to search for a document and it failed. No alert fired. No dashboard turned red. Nobody else has said a word about it.
That is the hardest kind of complaint I get. Not because the error is hard to find. Because at that volume, there is nothing telling me whether it is a real bug or just noise.
I am a cloud engineer here and don't typically write application code, certainly not enough to be a regular contributor to application code. I do read it when I need to in order to find out where problems might exist. That split matters for this post, because everything below is about narrowing a vague complaint down to a specific, defensible finding, not about fixing the code myself.
What changed for me recently is that I stopped running all of this by hand. I hand Claude a screenshot of the error, or just a rough timestamp of when the user hit it, and Claude does the searching across APM, the correlating against logs, and the reading of our actual codebase to explain why the error happened. It turns a single-user complaint from a dead end into something I can hand to the app team with confidence.
Why Single-User Issues Are Hard
Most alerting is built around volume or anomaly detection. Error rate crosses a threshold, response time drifts past a baseline, something spikes. One user hitting one error does not move any of those needles.
This is more notable depending on the scale of the org and where focus is directed. Feature velocity usually wins over defensive coding. Error handling is not always as complete as it would be somewhere with a bigger engineering team, so an exception showing up in the logs might be a known, harmless condition, or it might be a real gap nobody has hit before. There is no way to tell just by looking at the fact that an error happened.
I cannot always read the code and know the difference on sight either. I do not have years of history in this codebase the way the app developers do. So my job in this workflow is not to diagnose intent in the code myself. It is to get from "a user said something broke" to "here is the exact transaction, the exact log line, the exact method, and here is why it happens" and let the people who own the code make the call.
Step 1: Hand Off What the User Gave Me
There is no alert to start from, so I start from whatever the user gave me. A screenshot of the error. A rough timestamp. What they were doing. That is usually the whole prompt I give Claude to get started.
Facet-wide error rate queries are built to show trends, and a single event will not register as one. So instead of asking New Relic what is trending, Claude asks it what happened in a tight window around that timestamp:
SELECT count(*) FROM TransactionError FACET appName, error.message SINCE 30 days ago
Scanning that output for anything sitting at a count of one or two is usually where the real single-user cases hide. Everything else in that list is background noise from retries, transient timeouts, and known flaky dependencies. Once Claude has a candidate, it pulls the specific event:
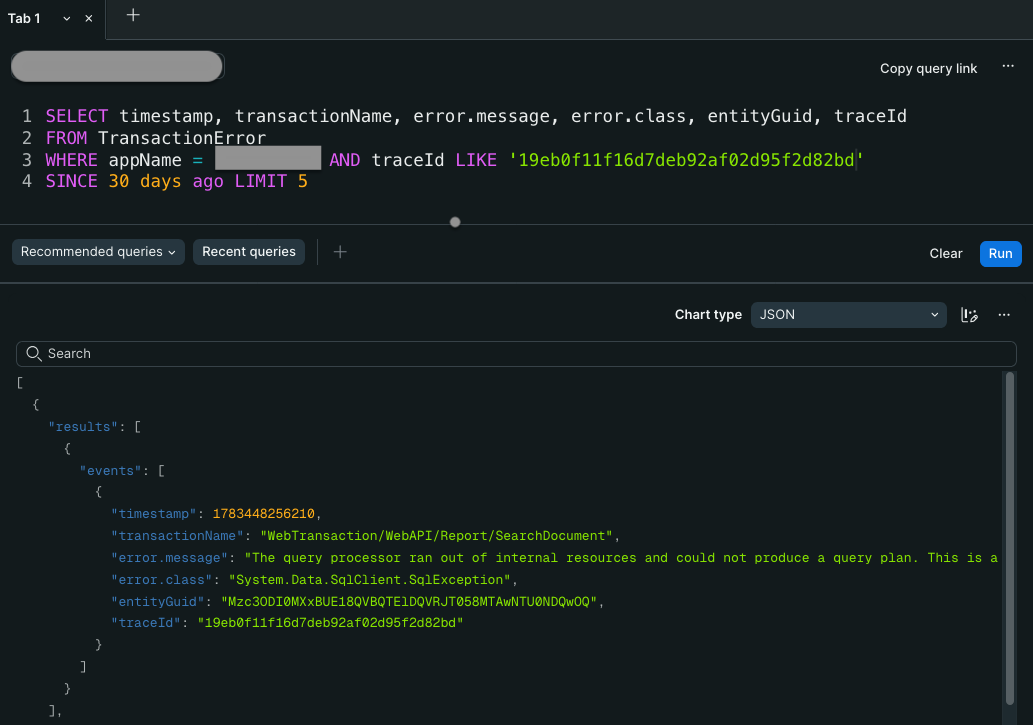
SELECT timestamp, transactionName, error.message, error.class, entityGuid, traceId
FROM TransactionError
WHERE appName = '<app>' AND error.message LIKE '%<fragment>%'
SINCE 30 days ago LIMIT 5
At this volume there is no trend line to look at. Just one row, and that row has to carry the whole investigation from here.
Step 2: Correlate to Logs
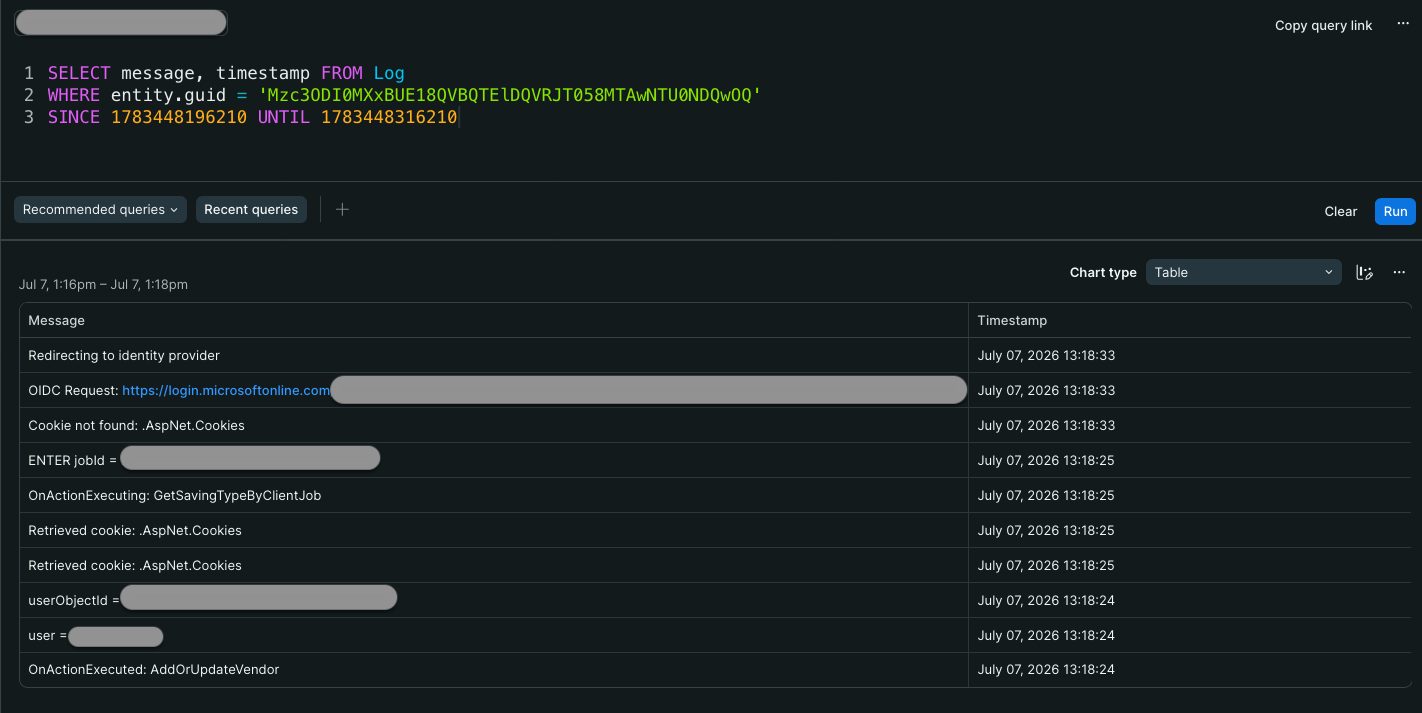
Once Claude has a trace id and an entity guid, it pulls the logs for that exact window and that exact entity:
SELECT message, timestamp FROM Log
WHERE entity.guid = '<guid>'
SINCE <timestamp - N seconds> UNTIL <timestamp + N seconds>
This is where the story starts to take shape. The log lines around the failure usually show what the user was actually doing right before things broke, which action fired, which parameters came through.
Step 3: Map It to the Code and Explain Why
This is the part that actually makes the workflow worth writing about. A file and a line number are not enough on their own. I ask Claude to read the method the transaction points to and explain, in plain terms, why that specific log message would come out of that specific code. Not a generic description of what that error class usually means. An explanation tied to the actual lines in front of it: this method does this, it calls that, and when it receives this kind of input, it produces this exact error.
That is the difference between a search tool and something worth handing to an app team. A grep gets me to the file. Claude reading the method and explaining the failure gets me a paragraph I can forward, or push back on if it does not hold up.
Step 4: Decide Benign or Bug
Signals that push me toward calling it a real bug: Claude's explanation shows the code path clearly does not account for the condition I am looking at, the error lines up with a behavior change the user actually described, or I can see how the same input would trip the same error for anyone else who happened to hit it.
Signals that push me toward benign: the exception is caught and handled somewhere else in the flow, the request succeeded on retry, or it traces back to a known, already-flaky downstream dependency.
From there I work with Claude to understand what the code is actually written to do and how that connects to the error in front of me. If Claude suggests a fix and it is small, under twenty lines and touching a single file, I will have it open a pull request for the dev team to review, using the Azure DevOps MCP server on my behalf. That PR gets a peer review and validation from someone who owns that code, and if there is time, a dev build to actually test the fix before it goes further. Anything bigger than that, I bring the app team the location, the evidence, and the explanation, and let them decide how to fix it.
A Real Example
Last month a user told me a document search had failed and gave me a rough time it happened. I handed that to Claude and asked it to find out what happened.
Claude found a single occurrence of a SqlException in one of our apps: "the query processor ran out of internal resources and could not produce a query plan." One event, in thirty days, tied to a document search transaction.
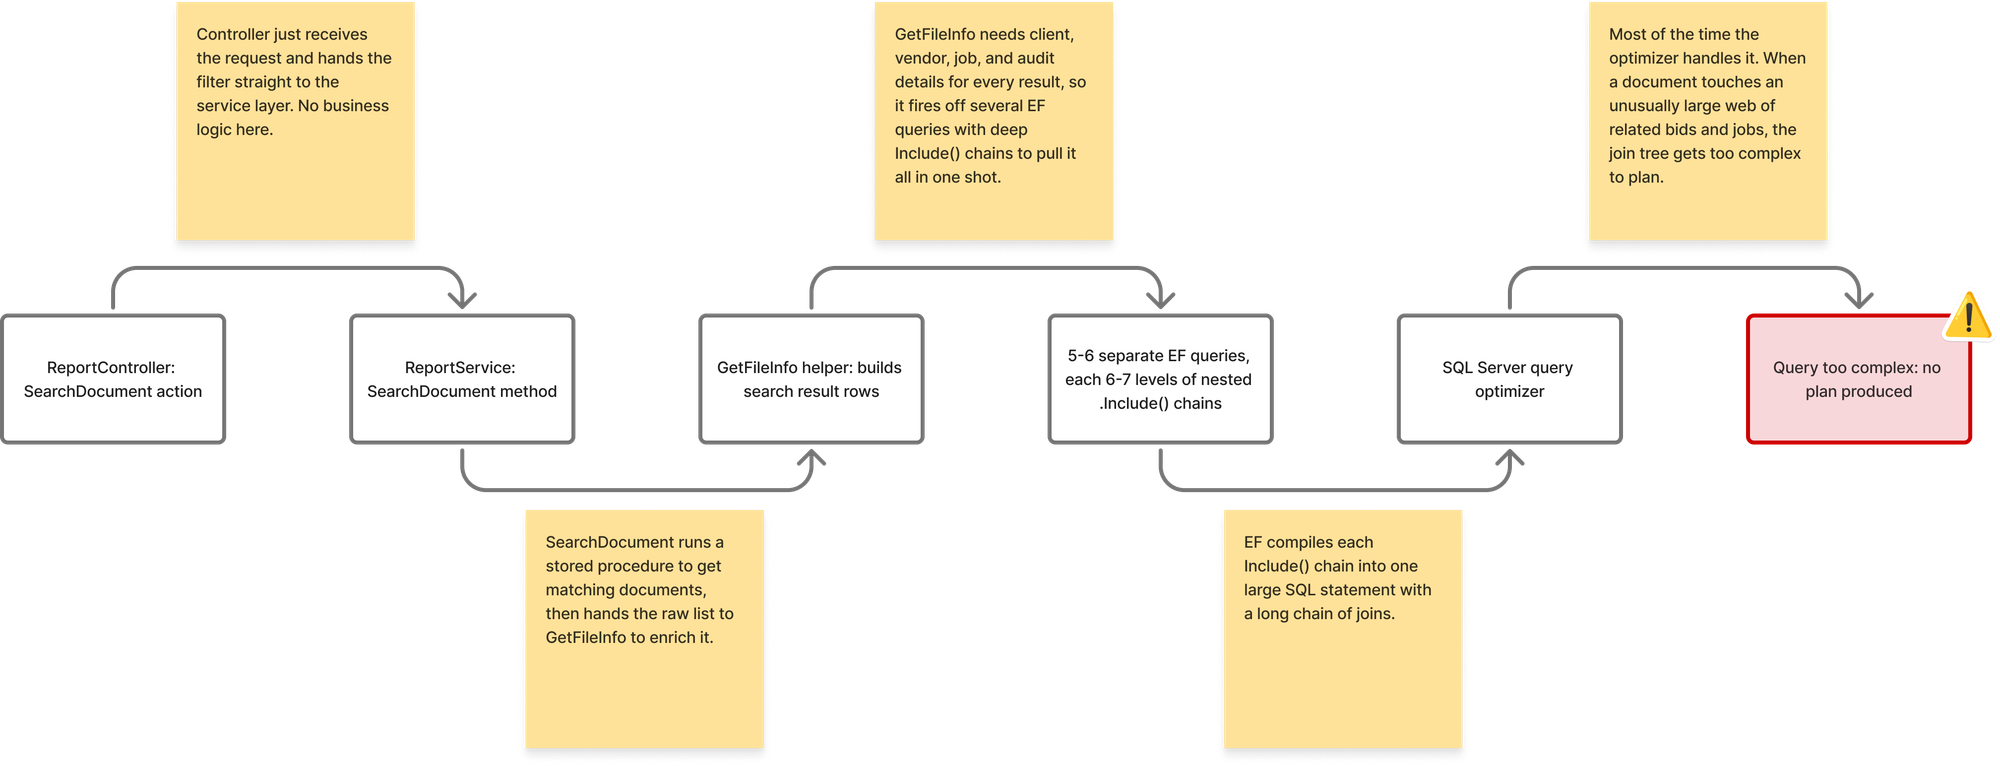
It pulled the logs around that trace and found the user had fired the document search action right before the failure. From there it traced the transaction to the actual code: a controller action that calls into a search method, which in turn calls a helper that builds out the search results by pulling in related records, bids, invoices, revisions, jobs, and each of their own related records, several levels deep, all in one method.
Then it explained why. That helper method runs five or six separate queries, each with an Entity Framework include chain six or seven levels deep. Claude walked through what that produces: EF turns a deeply nested include chain into one very large SQL statement with a lot of joins. Most of the time that is fine. Once in a while, if the specific document being searched happens to pull in an unusually large web of related bids and jobs, the query gets complex enough that SQL Server's optimizer gives up on producing a plan. It tied that explanation to the specific method in the specific file, not a generic description of what that error class usually means.
That explains why it only ever happened once. It is not a request that always fails. It is a request that fails only when the data behind it happens to be big enough, which is exactly the kind of thing that will never trip a volume-based alert and will look like a one-off unless someone traces it back.
I sent the app team the transaction, the trace, the method, and Claude's explanation of why the nested includes were producing that exact error. What they do with it, whether that means restructuring the query, adding a size check, or something else, is their call. My part was turning a rough timestamp into a defensible technical finding.
What This Actually Changes for a Small Team
The value here is not really about faster time to resolution, though that is a side effect. The real change is that I can contribute meaningfully to a problem that would otherwise sit outside my lane entirely.
I do not have a deep application development background. Without this workflow, a single-user complaint like this would just get forwarded to the app team as-is, with whatever vague detail the user gave me, and they would have to reproduce it from scratch on their own time. Now I hand Claude a screenshot or a timestamp, review what it finds, and send the app team something educated and metric-backed instead: here is the transaction, here is the log evidence, here is the method, and here, according to the actual code, is why it happened. They review it when they have time, instead of dropping what they are doing to chase a report with no starting point.
Lessons Learned
- Single-user issues need a time-anchored query, not a trend query. The volume will never show up in an aggregate view.
- Correlating by entity guid or trace id is far more reliable than by timestamp alone once you are down to one or two events.
query_nerdgraphover the plain NRQL tool, andSpanoverExternalfor dependency calls, matter even more at low volume. A wrong query at this scale returns nothing and looks like a dead end instead of an obviously wrong answer.- A file and line number is not enough. Asking Claude to explain why the code produces that specific message, tied to the actual lines, is what turns a location into something worth forwarding.
- Knowing when to stop and hand off to the app team is as important as the investigation itself.
Closing and Next Time
I went over at a highlevel my current workflows. This approach is not limited to only New Relic and this post is not sponsered in any form it is just the tools we have available today. I imagine this type of solution is possible on other platforms as well. In the following post I will be showing in detail how I set up my Claude files to make this possible with a single prompt.