Overview
Application Insights is a powerful tool for monitoring and troubleshooting which is provided by Microsoft Azure. It is designed to help developers monitor the performance, availability, and usage of their applications. By integrating Application Insights and making use of the data it provides, developers can gain deep insights into how their applications are performing, identify bottlenecks, and diagnose issues to ensure a smooth and efficient user experience.
Key Features
- Telemetry Data Collection: Application Insights collects telemetry data such as request rates, response times, and failure rates. This data is essential for understanding how the application behaves under different conditions and loads.
- Distributed Tracing: This feature helps in tracking requests across different components of a distributed system. It provides a comprehensive view of how requests are processed through the entire system, making it easier to identify performance bottlenecks.
- Integration with Development Tools: Application Insights integrates seamlessly with popular development tools such as Visual Studio, making it easy to add monitoring capabilities during the development process.
- Analytics and Machine Learning: The service includes powerful analytics capabilities, allowing developers to query and analyze telemetry data. Machine learning algorithms can also be applied to detect anomalies and predict potential issues.
Setting Up Application Insights Telemetry Tracking
Setting up Application Insights is easy and requires steps in both the code and the azure portal. The process includes creating an Application Insights resource in the Azure portal, integrating the SDK into the application, and configuring the necessary settings to start collecting telemetry data.
Step-by-Step Setup Guide
Step 1: Create an Application Insights Resource
- Log in to the Azure Portal: Navigate to the Azure portal and sign in with your Azure account credentials.
- Create a New Resource: In the Azure portal, click on "Create a resource" and search for "Application Insights". Select "Application Insights" from the search results and click "Create". The can also be initiated from the resource you wish to attach to, for instance, an app service.
- Configure the Resource: Fill in the required information such as the resource name, subscription, resource group, and region. Choose the appropriate region close to where your application is hosted for optimal performance. Click "Review + create" and then "Create" to provision the resource.
Step 2: Integrate the SDK into Your Application
The method of integrating Application Insights depends on the type of application you are developing, but they are all very similar.
For ASP.NET Applications:
- Install the SDK: Use NuGet Package Manager in Visual Studio to install the Application Insights SDK. Search for "Microsoft.ApplicationInsights.AspNetCore" and install the package.
- Initialize the SDK: In the Startup file, add the following code to initialize Application Insights:
public void ConfigureServices(IServiceCollection services)
{
    services.AddApplicationInsightsTelemetry(Configuration["ApplicationInsights:InstrumentationKey"]);
}
- Configure Instrumentation Key: Add the Application Insights instrumentation key to the appsettings.json file
{
    "ApplicationInsights": {
        "InstrumentationKey": "your-instrumentation-key"
    }
}
For Java Applications:
- Add the Dependency: Include the Application Insights SDK dependency in your pom file:
<dependency>
    <groupId>com.microsoft.azure</groupId>
    <artifactId>applicationinsights-core</artifactId>
    <version>2.6.2</version>
</dependency>
- Initialize the SDK: Initialize the SDK in your application’s main class:
ApplicationInsights.initialize("your-instrumentation-key");
For Node.js Applications:
- Install the SDK: Use npm to install the Application Insights SDK:
npm install applicationinsights --save
- Initialize the SDK: Initialize the SDK in your application’s entry point file:
const appInsights = require('applicationinsights');
appInsights.setup('your-instrumentation-key').start();
Step 3: Configure Application Insights
- Set Up Live Metrics: Enable Live Metrics in the Azure portal to monitor real-time performance and diagnostics data.
- Enable Distributed Tracing: If your application consists of multiple services, enable distributed tracing to get end-to-end visibility of requests across services.
- Enable Additional Logging: You will likely want to log your regular debug, information, and internal error messages to the logs as well. You can make a telemetry entry directly or you can configure app insights as your logging provider and log that data in trace statements. Setup for that looks like this in .Net
.ConfigureLogging((hostContext,logging) =>
{
    logging.Services.Configure<LoggerFilterOptions>(options =>
    {
        LoggerFilterRule defaultRule = options.Rules.FirstOrDefault(
            rule => rule.ProviderName == "Microsoft.Extensions.Logging.ApplicationInsights.ApplicationInsightsLoggerProvider");
        if (defaultRule is not null)
        {
            options.Rules.Remove(defaultRule);
        }
    });
    var configuration = hostContext.Configuration.GetSection("Logging");
    logging.ClearProviders();
    logging.AddApplicationInsights();
    logging.AddConfiguration(configuration);
});
- Optional Logging (Situational): Depending on the situation you find needing further analysis you may need to turn on option logging like SQL Query Logging or Request Body Logging
Using Application Insights
The Application insights portal provides developers with a wealth of tools and knowledge each with a specialty in helping fine tune, fix or enhance an application.
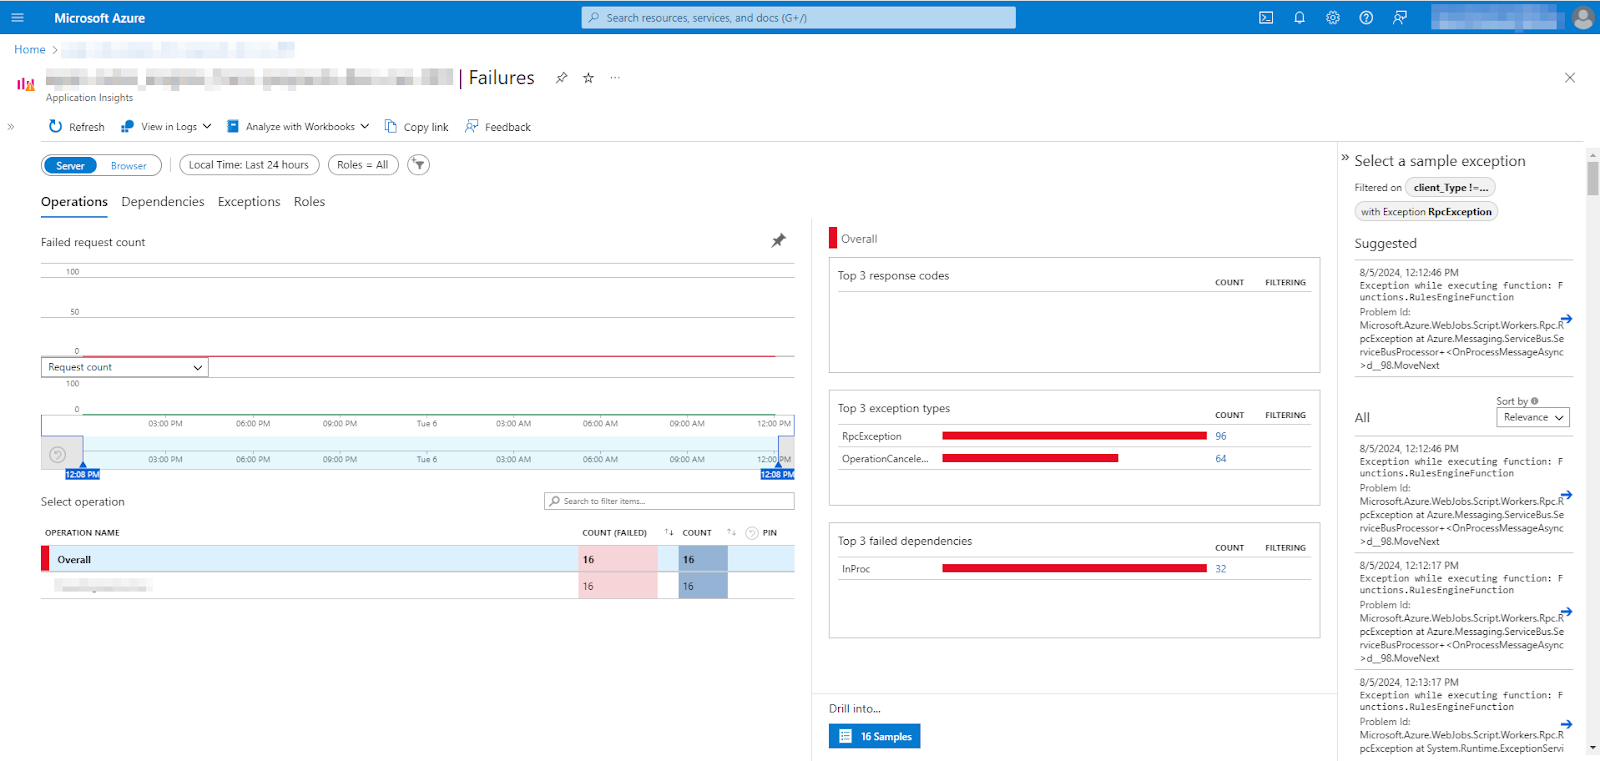
Failures
This section allows you to see both the HTTP call failures and exceptions thrown within your application. You can see details of the error and look into the stack trace to find the location. Additionally, if you have Visual Studio integrated with Application Insights you can view messages within VS and be taken to the exact place in code where the error was thrown. Failures is a great first stop when your application is having trouble and a good periodic check to ensure that your application is not throwing unseen errors.
Metrics
Metrics (both Live and Historical) are a great tool for analyzing the performance of your application. The metrics tools in Application Insights allows you to look at system metrics like CPU, Memory Usage, and I/O, as well as looking at more calculated metrics like dependency calls per second. These metrics allow you to get a well rounded view of your application. Dependency calls is a particularly great metric as those calls are often where bottlenecks in applications arise.

Transaction Search
The Transaction Search tool is a visual look at all of the messages your application sends to Application Insights. This includes messages indicating dependency use (SQL, HTTP Call) and trace logs, including your information or debug messages. If you enter the details of the message it will show you a timeline of all messages within the same request or transaction. This is incredibly useful in following a process from start to finish. You can look at the entirety of the process, examine the timeline of the calls to see where the gaps are, and identify hidden errors that could be affecting the over process. The transaction search includes the standard suite of tools to help you search and filter the messages to find what you are looking for.

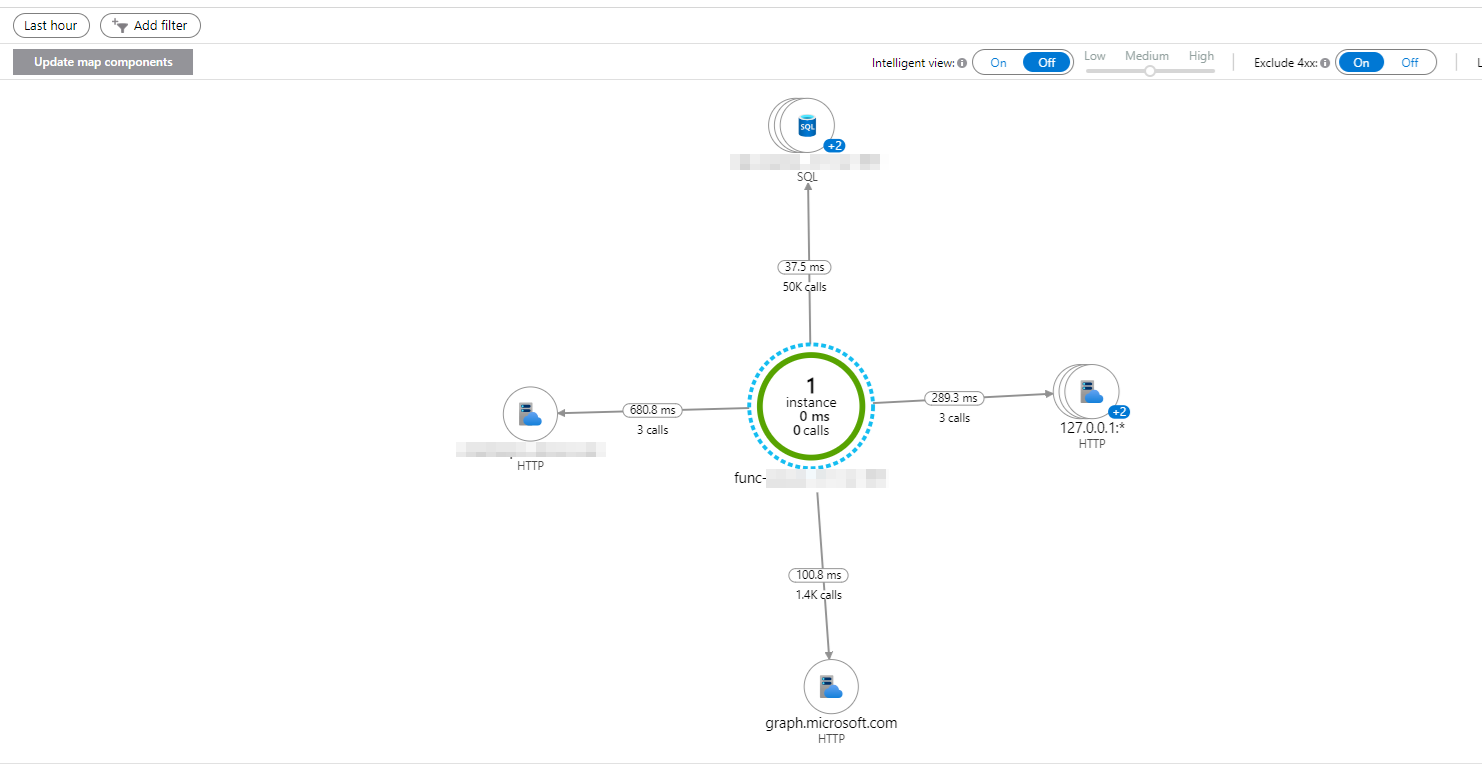
Application Map
The Application Map tool is often underutilized but is a great graphic representation of your application and its dependencies. For a given time (configurable) the tool will create a network map between your application and all of its dependencies. For example, if your application makes calls to a SQL Server database, the graph api, and a third party service, each of those, and your application, will have a node on the graph. In addition to just the relationship map, there is info about the number of calls and the average length of those calls. This gives you information to identify excessive dependency calls and find ways to cache, pull back data in groups, or batch writes to those locations. Furthermore, If you select a dependency you can break down the data for it based on endpoint or call type, and if you have turned on SQL Query logging or Request Body logging you can see that data here and examine your long running calls or most frequently made calls.
Logs
The Logs section is the old school, down and dirty way to access all of the same information you can access above. The interface provides a SQL-esc (KQL) query language that will allow you to query all of the telemetry and logging data stored for the application. There are a small number of sample queries, but for more complex queries there will be a lot of trial and error or searching for help online. While this tool has the greatest power potential, it is, by far, the hardest to use.

Conclusion
Application Insights is a versatile and powerful tool for monitoring and managing the performance and health of applications. By following the steps outlined above, developers can quickly set up Application Insights and start gaining valuable insights into their applications. With features such as real-time metrics, dependency maps, and distributed tracing, Application Insights empowers developers to proactively profile their applications and deliver a seamless user experience.